Filtering Data
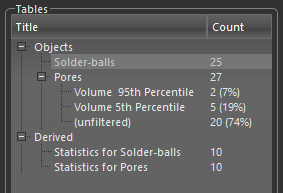
You can filter data that was added to a table to create sub-groups that match specific criteria. For example, data can be filtered within a range, by percentile, or by logical expressions such as less than, equal to, greater than, and so on.
Tables side panel
-
Do one of the following:
-
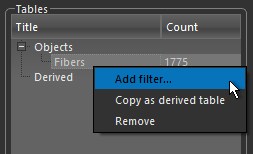
Right-click a table in the Tables side panel and then choose Add Filter in the pop-up menu.
-
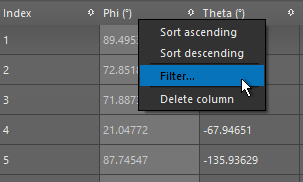
Right-click a table column and then choose Filter in the pop-up menu.
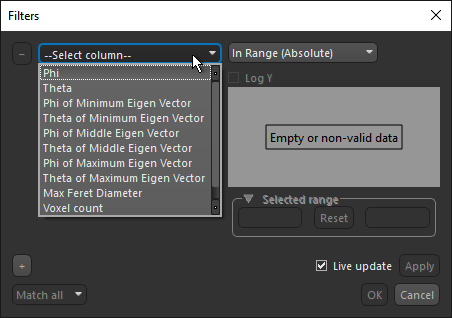
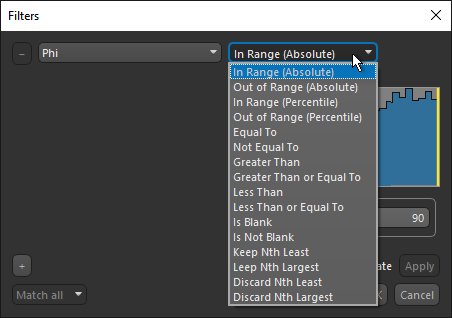
The Filters dialog appears.
-
-
Choose a measurement to filter your data with in the drop-down menu.
A new filter is added to the selected table.
-
Choose a filter in the drop-down menu.
-
Do the following, as required:
-
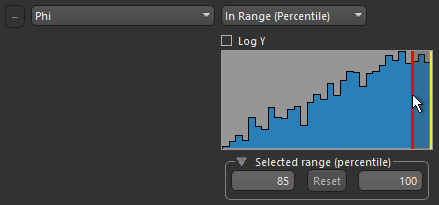
If you are filtering data within a range, select a range on the histogram or manually enter a range in the Min and Max edit boxes.
-
If you using a logical argument to filter data, such as equal to, greater than, or less than, enter a value in the edit box.

-
If you are filtering data by keeping or discarding the 'Nth' greatest or least values, enter a threshold in the edit box.

All instances that match the criteria are added to the filter. All other instances are left unfiltered.
Note If 'Live update' is checked, then the data will be filtered automatically. If this option is not checked, you will need to click Apply to filter the data.
-
-
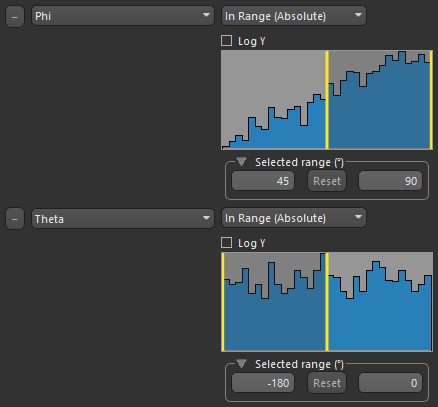
Add an additional filter, if required and as shown below.
-
Rename the filter, if required.
Note To rename a filter, double-click the name of the filter and then enter a new name.
